
Welcome to my Somerset County Market Report—a monthly update where I apply my expertise to break down the latest developments in our local real estate market. Each edition explores the economic factors and trends shaping property values in our community. This isn’t just a collection of numbers; it features hyper-local insights rarely available elsewhere. By the end, you’ll clearly grasp the “What” and the “Why” behind market movements, equipping you to make confident, informed real estate decisions throughout 2025.
You can also find a version of the report covering Hunterdon County here.
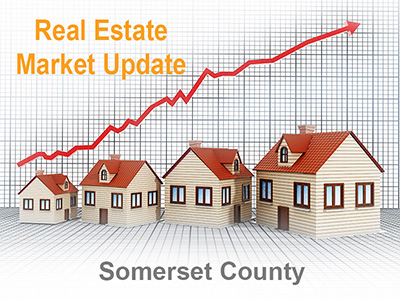
What’s Happening in Somerset County’s Real Estate Market?
352 Under Contract Listings $846K Average List Price 26 Average Days on Market
Interest rates remain stable at nearly 6.9% with no immediate relief in sight…
Statewide home sales in New Jersey remained relatively flat in 2024 compared to the previous year. So far in 2025, we’ve seen a modest 3% decline year-to-date.
In Somerset County, unsold inventory has increased nicely since last year.
Mortgage rates are hovering around 6.9%, holding steady from last month. Recent trade negotiations briefly pushed rates back above 7%, and they appear to be stabilizing at that level. Forecasts suggest a slow decline over the coming months, potentially dipping into the low 6% range by year-end. However, continued bond market volatility could cause rates to rise above 7% again before easing.
Zooming out, the broader real estate market is beginning to show signs of returning to a more balanced state. Inventory levels are approaching a four-month supply in the upper price tiers, which may trend downward. Fewer properties are now selling way above asking price, and more offers include traditional contingencies like financing, home sale, and inspection clauses. New listings have grown over the past month, boosting overall inventory. Yet, demand continues to exceed supply in our more popular penpoints, keeping upward pressure on prices throughout our region.
For those considering a move, these trends offer essential insights. The market still leans in favor of sellers, mainly due to the fast turnover of available homes, which helps sustain local price stability. However, we see early signs of a gradual shift toward a buyer’s market in the higher-end segments. Over the past five years, home prices in New Jersey have surged nearly 68%. In 2024 alone, growth was a more modest 8%. Homes priced at $900,000 and above now see rising inventory, which is beginning to affect supply-demand dynamics.
Meanwhile, properties under the $900K mark continue to appreciate, although the pace has slowed. Future gains are expected to be more moderate, yet still positive. Historically, home prices in the state have increased at an average annual rate of under 5% over the past fifty years.
🏡📈
Market Statistics for Somerset County:
- Last month, the market saw an increase in new inventory, with 308 new listings, compared to 273 in the previous month. This decreased from 356 new listings in the same month in 2024.
- As of the beginning of this month, the available inventory has increased to 512 units, up from 423 units last month. This is higher than last year’s 403 units available in the same month. A lot of this new inventory is in our higher price points.
- The number of units that went “under contract” last month was 352, up from the previous month’s 315, but a increase from the 259 units in the same month last year.
- Over the past month, the average number of days on the market has increased to 26, which shows a steady trend in the market (primarily seasonal).
- Currently, the month’s supply of inventory remains at just under 1.5 months, indicating a strong seller’s market. This trend holds for properties priced under $1,000K
Considering the current market conditions, where the supply and demand dynamics favor sellers, postponing your sale until later in 2025 may not be the best choice. The market is likely nearing (or at) its peak, and it’s unlikely that prices will remain elevated for much longer. Therefore, it would be wise to capitalize on the current situation and list your property for sale now.
In summary, acting promptly in the current market could benefit sellers.
New Jersey Residential Real Estate Market Forecast
The second half of 2024 saw solid activity in both listings and sales. Early 2025 was hampered by weather, but inventory is now above levels from a year ago.
Although inventory levels have recently increased, new listings continue to sell quickly, leading to strong sales and favorable prices for sellers. However, the biggest challenge in 2025 remains finding a more suitable home and securing an affordable mortgage.
The recent stability in interest rates has slowed buyers’ optimism compared to a few months ago. This has also similarly impacted trade-up buyers, although we are seeing more than in the past months.
However, interest rates have priced many first-time buyers out of the market, making most trade-up buyers still hesitant to move.
Until the average month’s supply nears 4 months, we will not see any appreciable price reductions.
Somerset County Real Estate Market Inventory Breakdown By Price For Last Month:
| May | May | Total | ||
| Somerset County | New | Under | Active | Months’ |
| Listings | Contract | Listings | Supply | |
| Condos/Town Houses * | 125 | 121 | 190 | 2 |
| Over 55 Communities* | 18 | 16 | 35 | 2 |
| $000K to $199K | 0 | 0 | 2 | |
| $200K to $299K | 11 | 8 | 17 | 2 |
| $300K to $399K | 36 | 34 | 47 | 1 |
| $400K to $499K | 48 | 51 | 78 | 2 |
| $500K to $599K | 33 | 33 | 63 | 2 |
| $600K to $699K | 32 | 50 | 54 | 1 |
| $700K to $799K | 31 | 39 | 44 | 1 |
| $800K to $899K | 32 | 33 | 44 | 1 |
| $900K to $999K | 17 | 22 | 28 | 1 |
| $1,000K and Up | 68 | 82 | 135 | 2 |
| Totals for May | 308 | 352 | 512 | 1 |
| Average Price | $843,851 | $845,509 | 0.2% | |
| Average Days on Market | 26 | |||
| * Included in $ breakdowns |
- 26% of sales in houses > $500,000
- 50% of sales in the $500,000 to the $1,00,000 range
- 23% of total sales (or 43 in total) in houses >$1,000,000
Somerset County Real Estate Market Inventory Breakdown By Municipality For Last Month
| Municipality | Active Listings | Under Contract in Last Month | Months Supply |
| Active Listings | Under Contract | Month’s Supply | |
| Bedminster Twp | 22 | 14 | 2 |
| Bernards Twp | 41 | 45 | 1 |
| Bernardsville | 23 | 9 | 3 |
| Bound Brook | 8 | 5 | 2 |
| Branchburg Twp | 21 | 12 | 2 |
| Bridgewater Twp | 66 | 59 | 1 |
| Far Hills Boro | 7 | 2 | 4 |
| Franklin Twp | 105 | 49 | 2 |
| Green Brook | 11 | 10 | 1 |
| Hillsborough | 45 | 41 | 1 |
| Manville Boro | 16 | 7 | 2 |
| Millstone Boro | 3 | 0 | |
| Montgomery Twp | 38 | 32 | 1 |
| North Plainfield | 15 | 12 | 1 |
| Peapack Gladstone | 9 | 3 | 3 |
| Raritan Boro | 6 | 2 | 3 |
| Rocky Hill Boro | 2 | 0 | |
| Somerville Boro | 16 | 9 | 2 |
| South Bound Brook | 2 | 4 | 1 |
| Warren Twp | 50 | 32 | 2 |
| Watchung Boro | 6 | 5 | 1 |
| Totals | 512 | 352 | 1 |
Two areas had no sales last month:
- Rocky Hill
- Millstone
Two areas had 1 or 2 sales each last month:
- Far Hills
- Raritan Boro
Hotspots:
- Bernardsville/Bernards Twp. – 54 Sales
- Bridgewater – 59 Sales
- Franklin Twp. – 49 Sales
- Hillsborough – 41 Sales
- Warren/Watchung – 47 Sales
Approximately 71% of sales were concentrated in the hotspot areas in the past month. Here’s a breakdown of the average prices:
- New Listings Entering the Market: The average list price for these new listings was $843,851.
- Units Going Under Contract: The average list price for units that went under contract was $845,509.
- This represents a .2% difference between the average prices of new listings and units under contract.”
In summary, understanding these price dynamics can provide valuable insights for real estate buyers and sellers.
Note:
If you want to obtain a competitive price for your property based on its location and uniqueness, you can contact me at (908) 304-4660. By leveraging Coldwell Banker’s big data technology and Artificial Intelligence capabilities, you can gain a unique advantage in the market. I can demonstrate your area’s latest age and earnings breakdown, including where people are moving from and how to market directly to those specific areas and demographics. This approach will maximize the selling price while reducing the time on the market. Accurately priced and marketed homes tend to sell faster with the assistance of a seasoned real estate industry veteran and a local area expert.
“Why” is it happening…
New Jersey’s Economic Drivers:
New Jersey Home Sales and Inventory Levels:
Contrary to what you see on the news, remember that real estate is hyper-local, and the Hunterdon and Somerset county markets remain strong. While the network news is correct for some areas in the country (mainly those with heavy new development sales), my report focuses only on our two counties in NJ, which consist primarily of resales. Our only new construction is mainly from the high end of the market.
- So far in 2025, we’ve seen a modest 3% decline in units sold year-to-date.
- Locally, sales in May in Hunterdon and Somerset County increased nicely compared to the previous month.
- There are early signs of some pullback in pricing at the higher price tiers, but the lower tiers are still seeing price increases, just not as aggressive as in the past.
- First-time buyers are cooling down considerably due to higher pricing (price resistance), inventory shortages, and interest rates. Their purchasing power has decreased for these reasons, and many have been priced out of the market for now. Also, higher insurance and taxation are being added to this equation.
- Potential sellers find it challenging to locate suitable housing in the current market and are hesitant to list until they do. They are also dismayed by higher interest rates than they currently have in place on their current homes and, for the most part, are not willing to make a move unless they have an urgent issue, such as a life event or job transfer. Higher interest rates also diminish their purchasing power, but their equity increases could offset it.
- Current mortgage statistics show that nearly 40% of homeowners own their homes outright. The other 60% are split evenly between mortgages with interest rates under 4% and above 4%. The group under 4% is not likely to make a change due to its current low rates.
- The current month’s inventory supply in Hunterdon County is at 1.7 months. In Somerset County, it is around 1.45 months due to the rapid sales of new listings (velocity) as the market remains active.
- Hunterdon has 11% more inventory, and Somerset County has 27% more than a year ago. The unsold inventory in New Jersey has steadily decreased since reaching a peak of over 20,000, and it is down to about 16,300 today. It should be noted that all price points have seen YTD increases statewide.
- New housing development has not kept up with population growth and is now focused on the rental market.
Interest Rates:
- Interest rates hovered around 6.9% again in early June of 2025.
- The Fed cut rates by 1% in the 4th quarter, which was already built into the current rates as they were widely expected.
- Since then, economic conditions (fears of continued inflation and high unemployment) caused the rise back to about 7% and are now down to 6.9%
- Based on recent economic indicators, rates are expected to drop slowly. However, we are probably stuck in the 6.75 to 7% range for now (time will tell). We may see further declines in the year’s second half, but not nearly 6%.
- Many buyers consider attractive ARM rates and creative other buy-down plans as alternatives.
- Based on the current rates, first-time buyer mortgage applications have dropped, but restructuring debt and paying down high-interest items remain active.
- The Fed’s efforts to slow things down have resulted in the above.
National Job Front:
- The U.S. Bureau of Labor Statistics reported that total nonfarm payroll employment increased by 139,000 in May, and unemployment remained at 4.2 percent. Employment continued growing in non-government, health care, social assistance, and construction.
- At the same time, March numbers were reduced by 65,000, and April numbers by 30,000, affirming that the U.S. labor market remains stable. However, this gets little exposure on the network news channels.
- This first report showed that most jobs were created in the private sector, and the average wage rose by 4%.
- It’s important to note that this number includes natural job growth of about 175K per month.
- The labor force participation rate dropped slightly to 62.4 percent. This rate is calculated by dividing the sum of all workers employed or actively looking for a job by the working-age population. It also fluctuates because people take a second job to make ends meet.
- Many have resigned to pursue new career paths due to perceived health risks, the desire for more remote work, and a better work-life balance. New technology-based jobs are affecting this trend, which seems to be reversing, especially in larger firms.
- For those under $50K, there is even some incentive not to work and collect benefits, contributing to the current unemployment rate.
- The lower end of the job market has benefited the most from this trend, with higher starting pay rates competing for a lack of workforce. Jobs beginning in the mid to upper $20 per hour are already being offered.
New Jersey Job Front:
- Statewide, we saw a decrease in new jobs of 66% in 2024.
- The unemployment rate in NJ for April rose to 4.8%, still quite a bit above the national rate.
- NJ gained about 39,800 jobs YTD through December 2024, compared to 90,000 in 2023. However, the state only added 4,800 jobs YTD.
- Job losses are still prevalent in the construction, food services, and accommodations industries. Retail and wholesale trade are also experiencing a downturn in some states. Even health care, social assistance, and manufacturing are shedding workers.
- NJ was hit harder than most states in the early months of the pandemic, but it has made a remarkable recovery since then.
- It should be noted that the number of jobs in New Jersey is a month behind the national level.
Rental Market Trends:
- Rental prices in central New Jersey continued to increase in 2024, with a year-over-year average of just over 2%. They are currently averaging just over $2,400 per unit. However, recent data shows a slight decrease in these prices, and over 32,000 units are now under construction.
- The vacancy rate in central New Jersey is currently at 5.1%, indicating an increase in rental supply and leading to a decrease in rental prices.
- The rental market typically includes low-end buyers who opt to rent due to a shortage of available inventory. However, the recent constraints in the mortgage market have also contributed to the increase in this sector.
- In a nutshell, many renters would prefer to buy a home as it is a good financial investment, but find the availability and affordability issues that force them into renting for now.
New Jersey Foreclosures:
- NJ’s delinquency rate (more than 90 days past due) has decreased, which is a positive development.
- NJ’s current foreclosure rate remains low at 1.1%.
- Nationally, $11 trillion in equity is needed to protect homeowners during a potential recession.
- The average FICO score of mortgage holders is over 750, higher than during the 2008 financial crisis.
- A slowdown and recession could still cause job losses and put mortgages at risk.
- A housing bust is not predicted to occur since there is a lot of positive equity in houses, thanks to recent appreciations.
Real Estate Market Recap
Forecast:
- The COVID-19 pandemic is now behind us.
- Supply chain shortages have affected inflation, and concerns remain that undersupply could cause further price increases.
- The consumer price index, which rose by 3% over the past 12 months, continues to cause havoc on auto, finished goods, and energy pricing and is the enemy of long-term interest rates. The April YOY for this year is at +2.6%, which is encouraging.
- Mortgage rates have reversed their 3Q24 pullback and are now around 6.9%.
- The local inventory accumulates primarily in the more expensive price ranges, and the housing affordability index has increased slightly (based on wages, rates, and home prices). As a result, mortgage payments now have an all-time high gross percentage (which slows spending in other sectors).
- Due to COVID-19 and recent unrest in NYC, interest in living in more suburban counties such as Hunterdon and Somerset has disappeared. In fact, many companies now require more on-site presence, reversing the move westward.
- Retailing and using vacant industrial space will transform to meet the new, altered demands and lifestyles.
- The local market will have to adapt to the new suburban renaissance regarding where people will work and what they need to adapt.
- The lingering question has been, “Can we keep this momentum up with low to slightly rising inventory?” as predictions for slower sales and price increases in 2024 have already been made. Price increases were about 11% in 2023 and 8% in 2024 in NJ. In 2025, the predictions are around the 2 to 3% range.
- Days on the market in our area have risen or remained the same over the past month, showing that buyers are becoming less active during the winter months.
- However, change will result in a trend towards a more normalized environment if inventory continues to come onto the market and first-time buyer fatigue continues.
- Younger (millennial) buyers are coming of age in the pipeline for at least the next four to five years, which will continue to put more demand on the first-time buyer market, usually under $400K, where inventory is off by 14% over this time in 2024.
- Housing markets are adding much of the new inventory at higher price points, normalizing those results. Change usually happens from the top down and from east to west.
- In a nutshell, 2025 looks much like 2024, with more inventory and fewer sales. As a result, prices are still rising across Hunterdon and Somerset County until they reach the $1,000,000 mark. The real question remains if and when we will see prices and interest start to drop.
This is substantial information, and the situation is evolving daily. Nevertheless, it appears to be moving in a positive direction for now. If you require further clarification or have any concerns about how this could impact your circumstances, please don’t hesitate to contact me at (908) 304-4660. I’m always available to chat and assist you in gaining a better understanding.
Note: Joe Peters of Coldwell Banker Residential Brokerage presents this information as a public service. Although reasonable care has been taken to provide this information, it is advised that you seek the guidance of a professional sales agent and avoid making any decisions solely based on my views, gathered trends, and statistics. I am not responsible for any consequences of using this data.
If you have any questions or would like to talk out your situation, please call 908-304-4660
Home Prices Forecast To Climb over the Next 5 Years [INFOGRAPHIC]
You can ask me a question or request a monthly newsletter copy here.